
4.0: Introduction
In this section, we will explore some of the monitoring options we have in Azure and how those can be used to troubleshoot and diagnose issues in a VDC environment. The first tool we will look at is Network Watcher. Network Watcher is a collection of tools available to monitor and troubleshoot issues with network connectivity in Azure, including packet capture, NSG flow logs and IP flow verify.
4.1: Enabling Network Watcher
Before we can use the tools in this section, we must first enable Network Watcher. To do this, follow these steps:
1) In the Azure portal, expand the left hand menu and then click All Services. In the filter bar, type ‘Network Watcher’ and then click on the Network Watcher service.
2) You should see your Azure subscription listed in the right hand pane - find your region and then click on the’…’ on the right hand side. Click ‘Enable Network Watcher’:
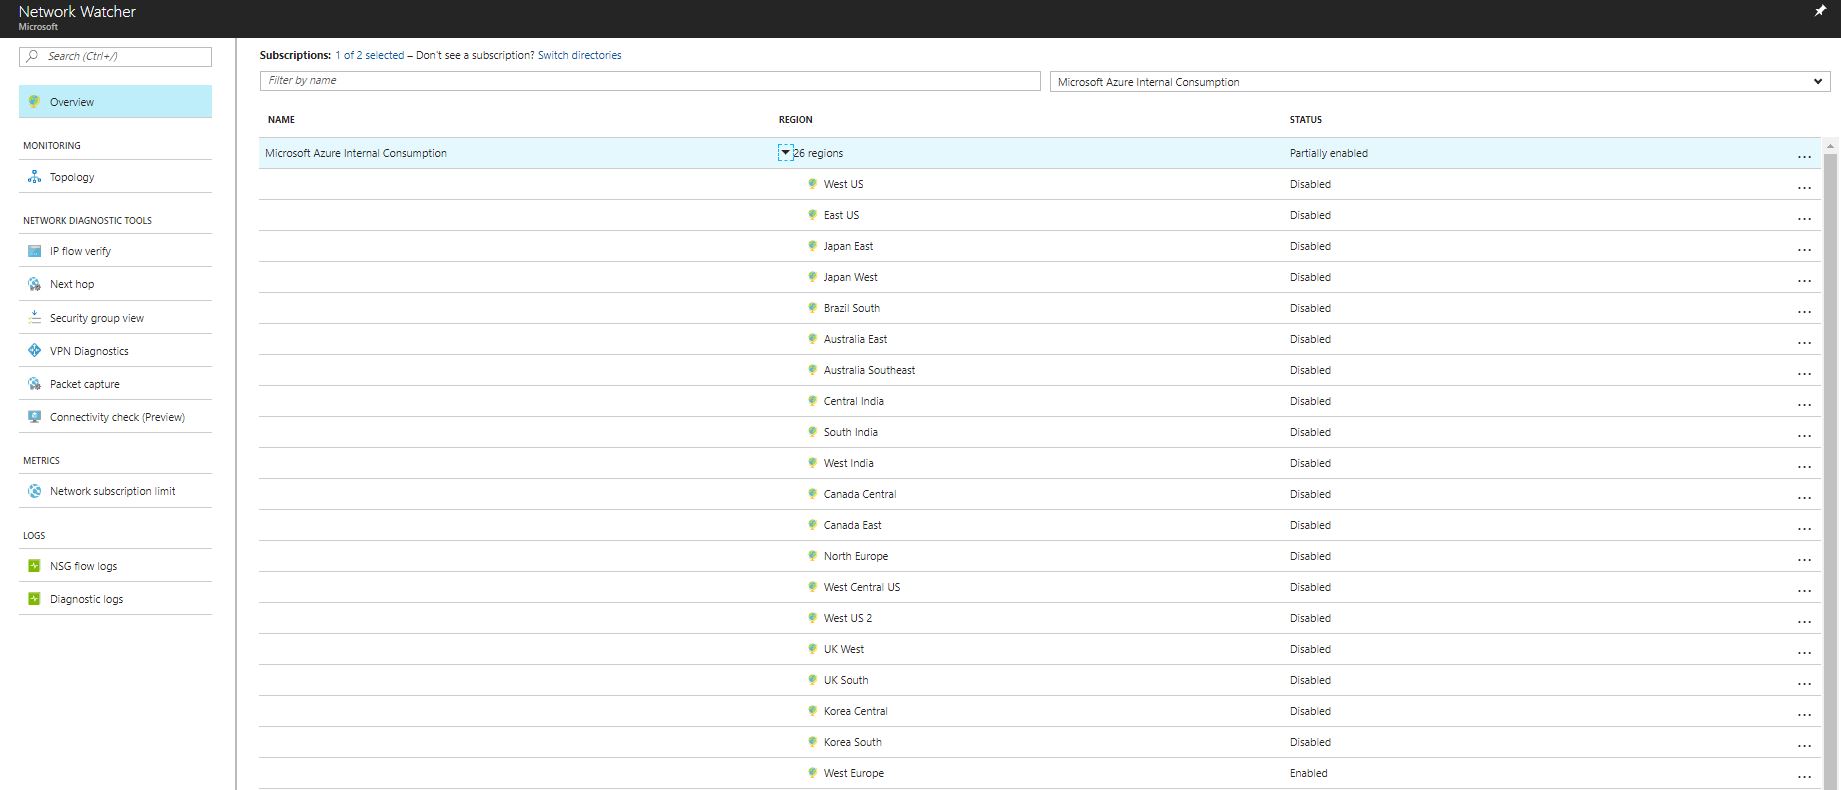
Figure 16: Enabling Network Watcher
3) On the left hand side of screen under ‘Monitoring’, click on ‘Topology’. Select your subscription and then the resource group ‘VDC-Hub’ and ‘Hub_Vnet’. You will see a graphical representation of the topology on the screen:
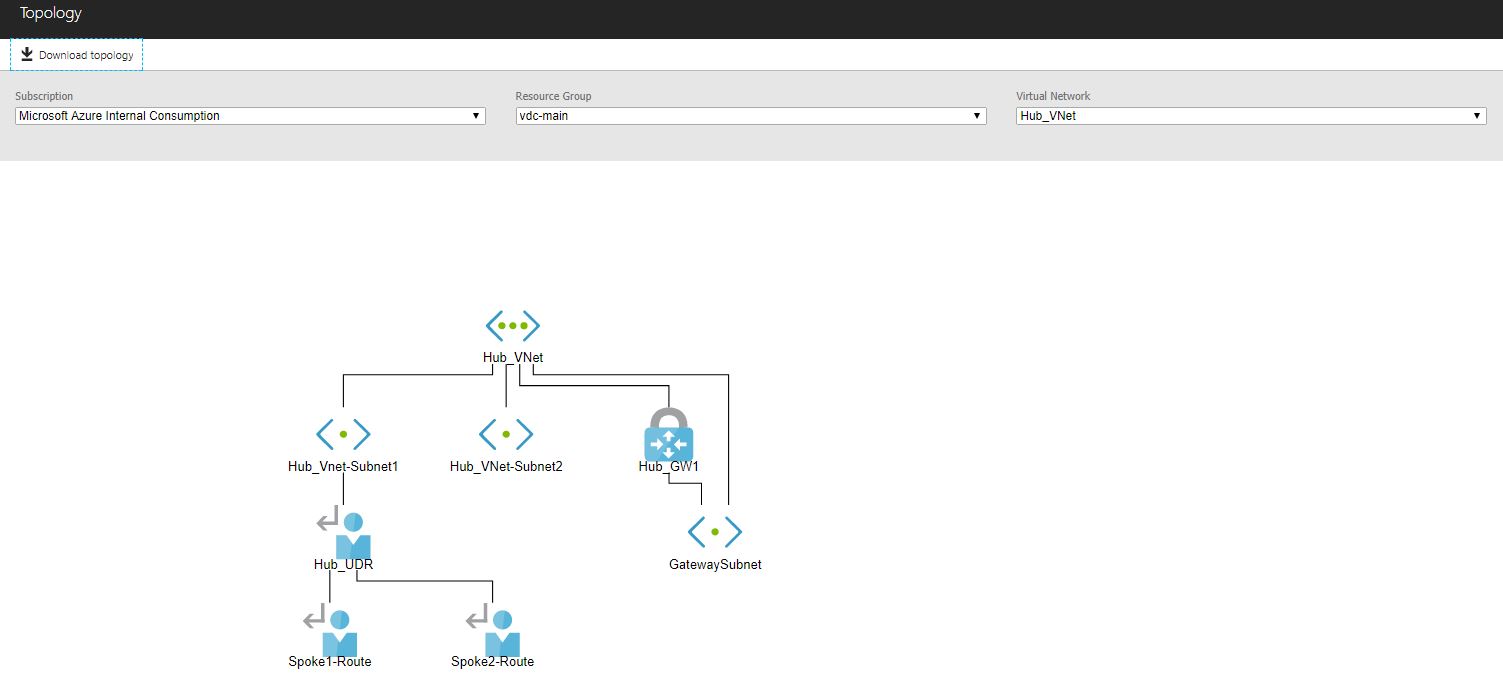
Figure 17: Network Topology View in Network Watcher
4) A useful feature of Network Watcher is the ability to view network related subscription limits and track your resource utilisation against these. In the left hand menu, select ‘Network Subscription Limit’. You will see a list of resources, including virtual networks, public IP addresses and more:
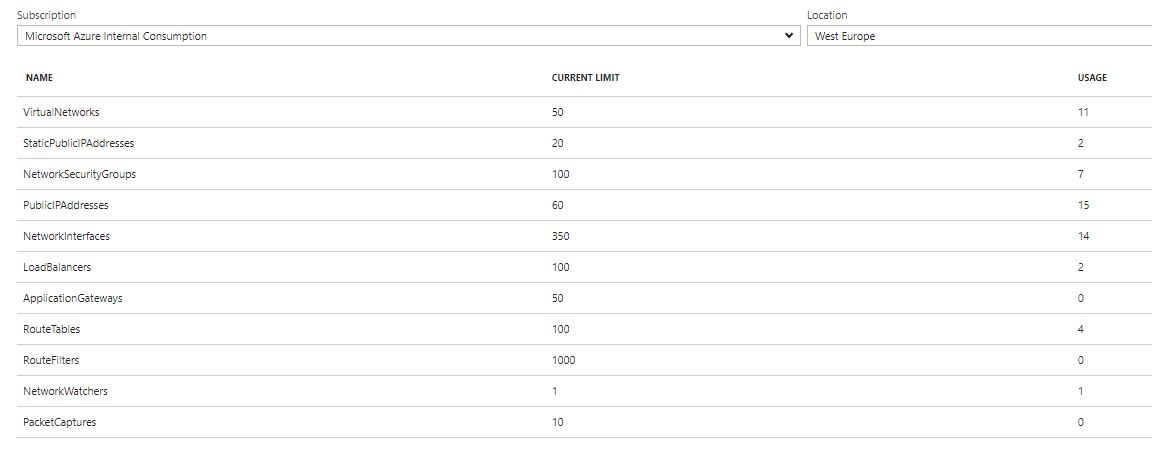
Figure 18: Network Related Subscription Limits
4.2: NSG Flow Logs
Network Security Group (NSG) Flow Logs are a feature of Network Watcher that allows you to view information about traffic flowing through a NSG. The logs are written in JSON format and are stored in an Azure storage account that you must designate. In this section, we will enable flow logging for the NSG we configured in the earlier lab and inspect the results.
1) To begin with, we need to create a storage account to store the NSG flow logs. Use the following CLI to do this, substituting the storage account name for a unique name of your choice:
az storage account create --name storage-account-name -g VDC-Hub --sku Standard_LRS
2) Use the Azure portal to navigate to the Network Watcher section (expand left menu, select ‘All Services’ and search for ‘Network Watcher’). Select ‘NSG Flow Logs’ from the Network Watcher menu. Filter using your subscription and Resource Group at the top of the page and you should see the NSG we created in the earlier lab.
3) Click on the NSG and then in the settings screen, change the status to ‘On’. Select the storage account you created in step 1 and change the retention to 5 days. Click ‘Save’.
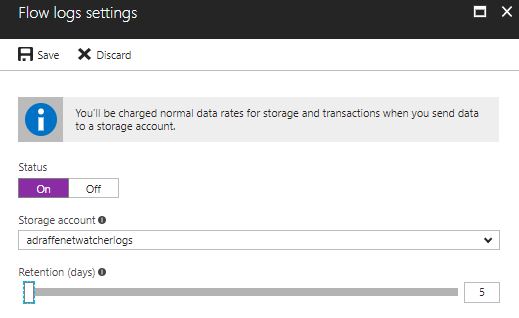 Figure 19: NSG Flow Log Settings
4) In order to view data from the NSG logs, we must initiate some traffic that will flow through the NSG. SSH to the OnPrem_VM1 virtual machine as described earlier in the lab. From here, use the curl command to view the demo app on Spoke1_VM1 (through the load balancer) and attempt to SSH to the same VM (this will fail):
curl http://10.1.1.4
ssh labuser@10.1.1.5
5) NSG Flow Logs are stored in the storage account you configured earlier in this section - in order to view the logs, you must download the JSON file from Blob storage. You can do this either using the Azure portal, or using the Microsoft Azure Storage Explorer program available as a free download from http://storageexplorer.com/. If using the Azure portal, navigate to the storage account you created earlier and select ‘Blobs’. You will see a container named ‘insights-logs-networksecuritygroupflowevent’. Navigate through the directory structure (structured as subscription / resource group / day / month / year / time) until you reach a file named ‘PT1H.json’. Download this file to your local machine.
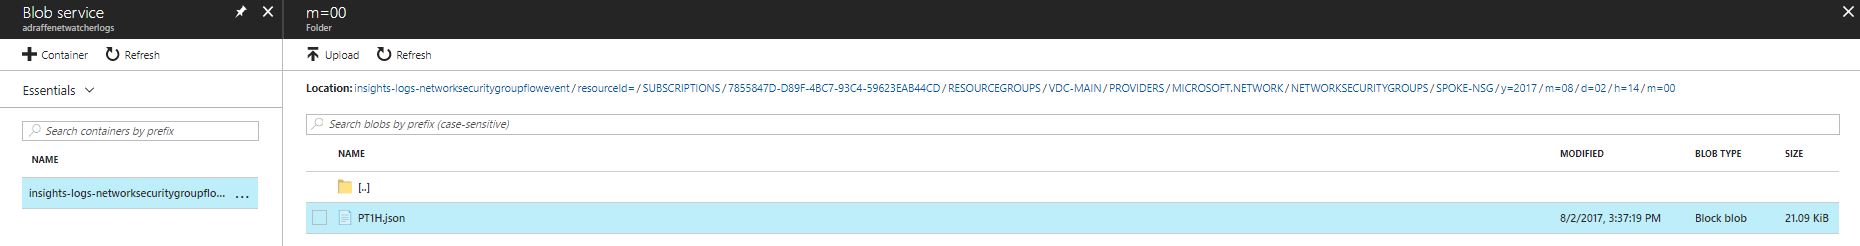
Figure 20: NSG Flow Log Download
6) Open the PT1H.json file in an editor on your local machine (Visual Studio Code is a good choice - available as a free download from https://code.visualstudio.com/). The file should show a number of flow entries which can be inspected. Let’s start by looking for an entry for TCP port 80 from our OnPrem_VM1 machine to the Spoke1 load balancer IP address. You can search for the IP address ‘10.102.1.4’ to see entries associated with OnPrem_VM1.
Here is an example of a relevant JSON entry:
"rule":"UserRule_Allow-HTTP","flows":[{"mac":"000D3A25DC84","flowTuples":["1501685102,10.102.1.4,10.1.1.5,56934,80,T,I,A"
The above entry shows that a flow has hit the user rule named ‘Allow-HTTP’ (a rule that we configured earlier) and that the flow has a source address of 10.102.1.4 and a destination address of 10.1.1.5 (one of our Spoke1 VMs), using TCP port 80. The letters T, I and A signify the following:
- T: A TCP flow (a ‘U’ would indicate UDP)
- I: An ingress flow (an ‘E’ would indicate an egress flow)
- A: An allowed flow (a ‘D’ would indicate a denied flow)
7) Search the JSON file for a flow using port 22 (SSH).
"rule":"UserRule_Deny-All","flows":[{"mac":"000D3A25DC84","flowTuples":["1501684054,10.102.1.4,10.1.1.5,60084,22,T,I,D"
The above example shows a flow that has hit our user defined rule name ‘Deny-All’. The source and destination addresses are the same as in the previous example, however the TCP port is 22 (SSH), which is not allowed through the NSG (note the ‘D’ flag).
4.3: Tracing Next Hop Information
Another useful feature of Network Watcher is the ability to trace the next hop for a given network destination. As an example, this is useful for diagnosing issues with User Defined Routes.
1) Navigate to Network Watcher as described in earlier sections.
2) In the left hand menu, select ‘Next Hop’. Use the following parameters as input:
- Resource Group: VDC-Spoke1
- Virtual Machine: Spoke1-VM1
- Network Interface: Spoke1-VM1-nic
- Source IP address: 10.1.1.5
- Destination IP address: 10.102.1.4
3) The resulting output should display 10.101.2.4 as the next hop. This is the IP address of our Network Virtual Appliance (Cisco CSR) and corresponds to the User Defined Route we configured earlier.
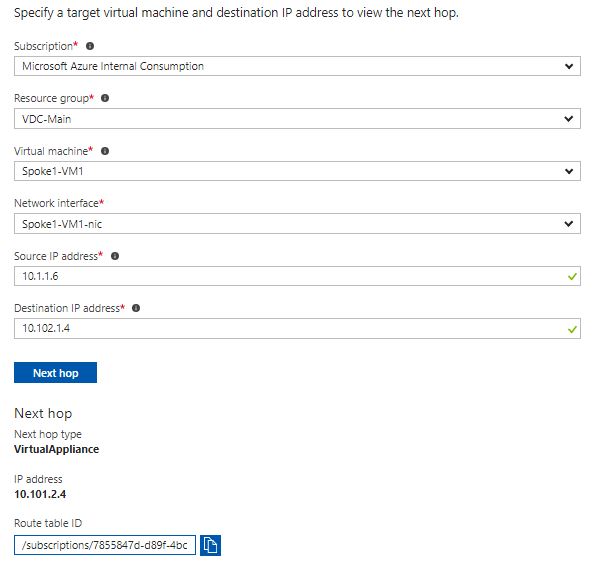
Figure 21: Next Hop Tracking
4) Try other combinations of IP address / virtual machine. For example, reverse the IP addresses used in the previous step.
4.4: Metrics and Alerts with Azure Monitor
Azure Monitor is a tool that provides central monitoring of most Azure services, designed to give you infrastructure level diagnostics about a service and the surrounding environment. In this section of the lab, we will use Azure Monitor to look at metrics on a resource and create an alert to receive an email when a CPU threshold is crossed.
1) Start by using the Azure portal to navigate to the Azure Monitor view by expanding the left hand main menu and selecting ‘Monitor’. If it is not shown, select ‘All Services’ and search for it. Select ‘Activity Log’ from the left hand menu. This shows a filterable view of all activity in your subscription - you can filter based on timespan, event severity, resource type and operation. Modify some of the filter fields in this screen to narrow down the search criteria.
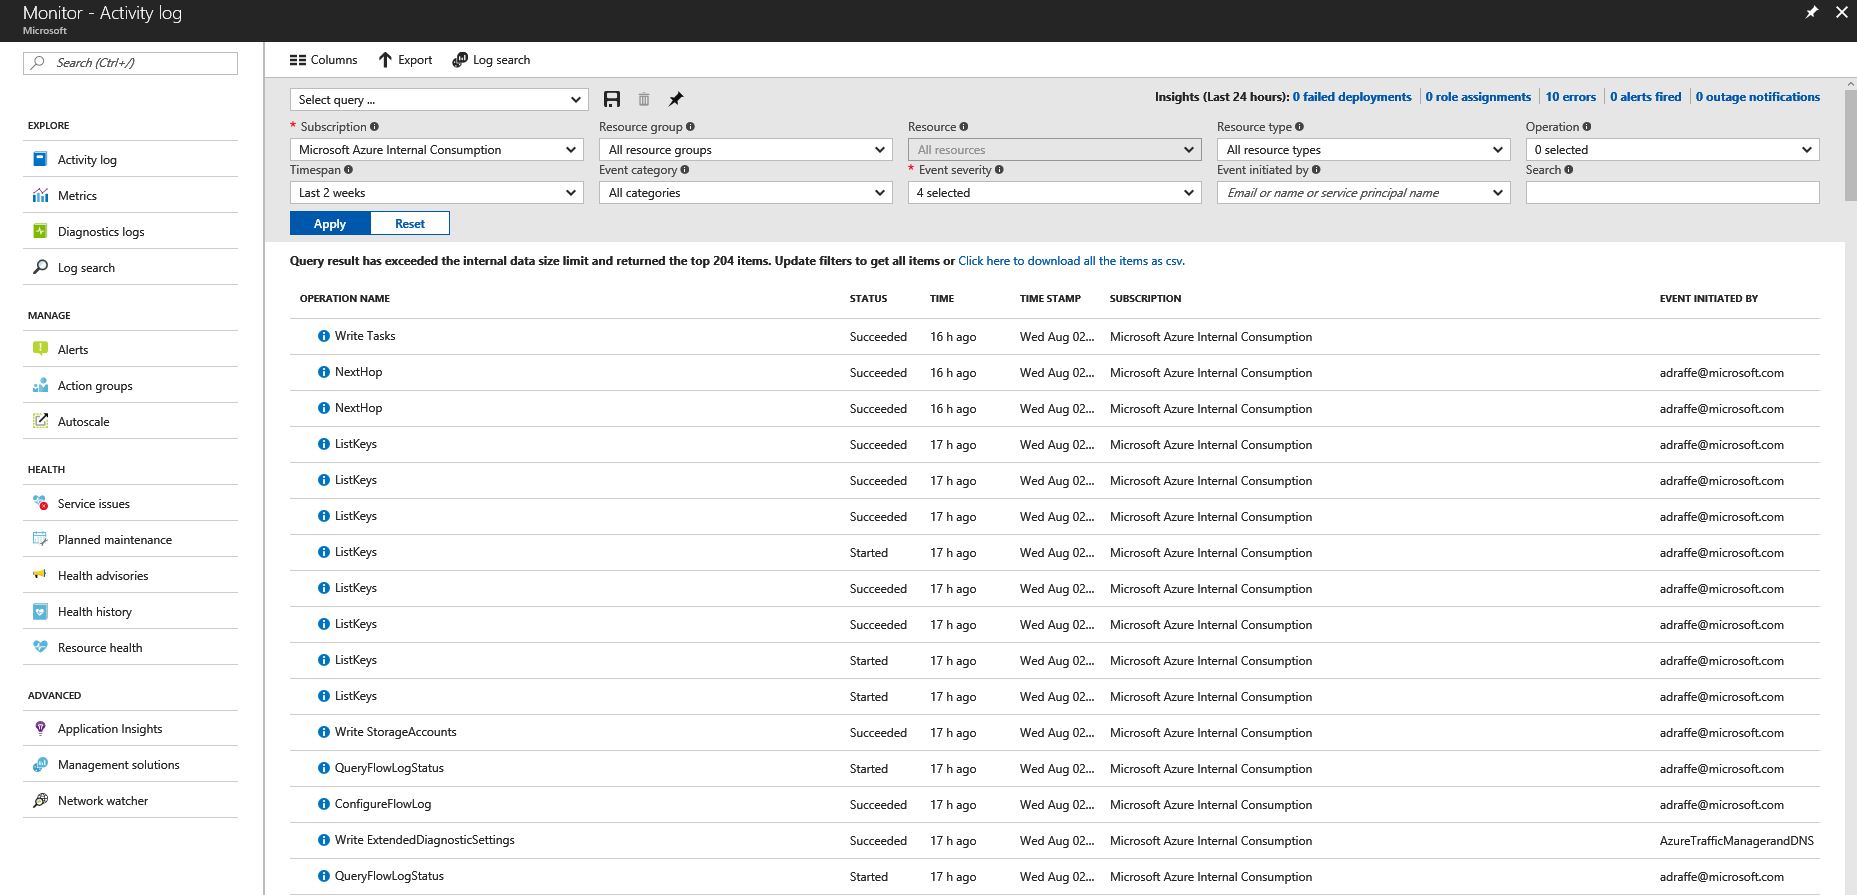
Figure 22: Azure Monitor Activity Log
2) In the Azure Monitor menu on the left, select ‘Metrics (Preview)’. In the ‘resource’ box at the top of the screen, search for ‘onprem’ and then select the ‘OnPrem1_VM’ virtual machine in the drop-down menu. Select ‘host’ as the sub-service and then ‘Percentage CPU’ as the metric.
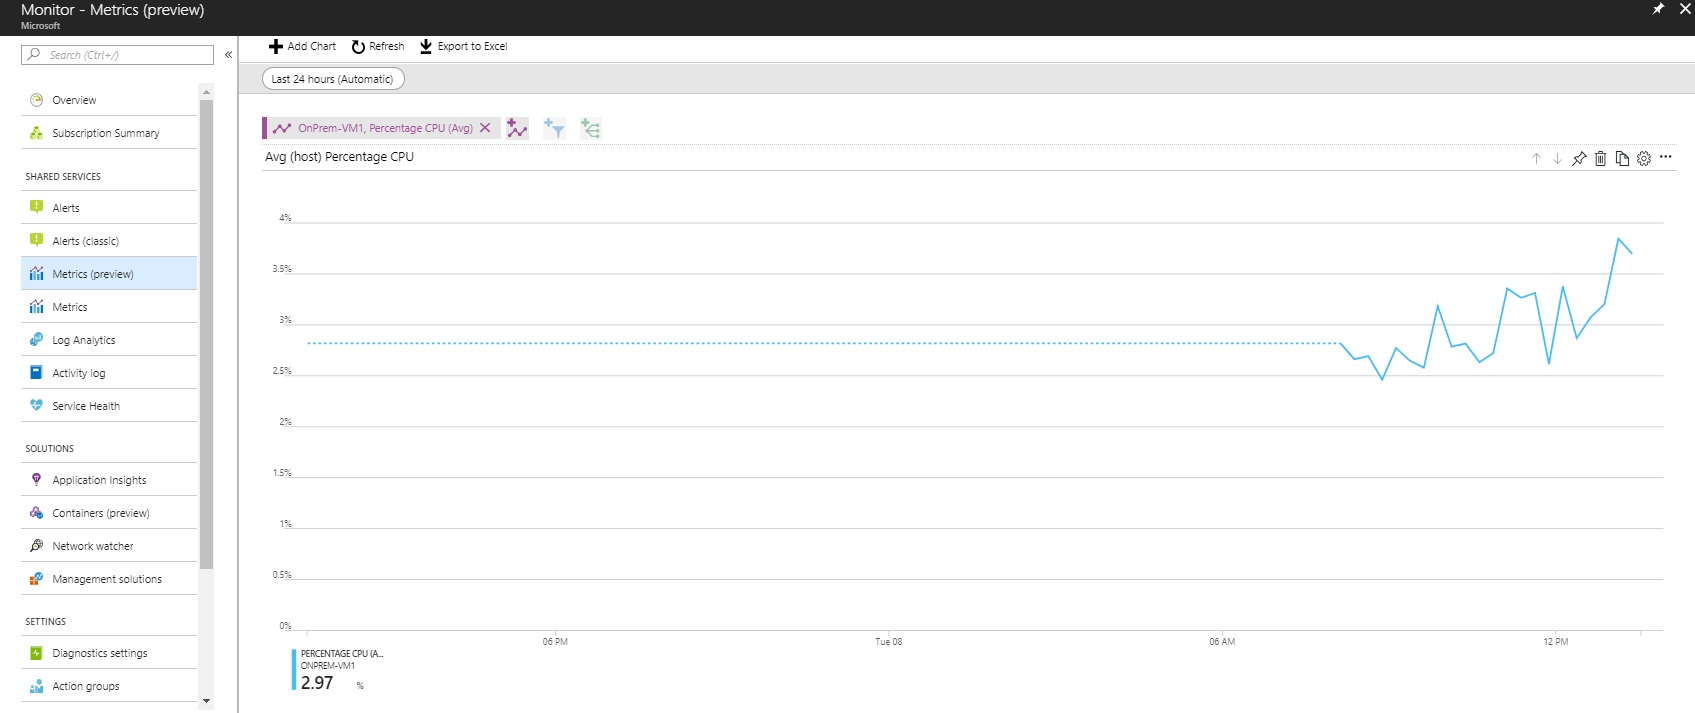
Figure 23: Azure Monitor CPU Metrics
3) For all types of metric displayed, it is possible to configure alerts when a specific threshold is reached. Select ‘Alerts’ from the left hand menu and then click on ‘New Alert Rule’ at the top of the screen.
4) Click on ‘Select Target’ and then choose your subscription. Select ‘Virtual Machines’ as the resource type and then choose ‘OnPrem-VM1’.
5) Click on ‘Add Criteria’ and then select ‘Percentage CPU’ as the signal type.
6) Under ‘Alert Logic’, ensure the condition is ‘Greater than’ and set the threshold to 40%. Change the period to ‘Over the last 1 minute’.
7) Expand the section named ‘Define Alert Details’. Name the alert rule ‘alert-cpu’ and give it a suitable description. Click OK.
8) Expand the section named ‘Define Action Group’. Name the action group ‘alert-email’ (use this for the short name as well). Under ‘Actions’, use the same name and select ‘Email/SMS/Push/Voice’. In the resulting dialog box, configure your own email address. Select OK.
9) On the main page, click ‘Select Action Group’ and select the group you have just configured.
10) SSH to your OnPrem_VM1 virtual machine and install the ‘Stress’ tool:
sudo apt-get install stress
11) Use the Stress program to hog the CPU:
stress -c 50
stress: info: [61727] dispatching hogs: 50 cpu, 0 io, 0 vm, 0 hdd
12) After approximately 5 minutes, you should receive an email alerting you to the high CPU on your VM:
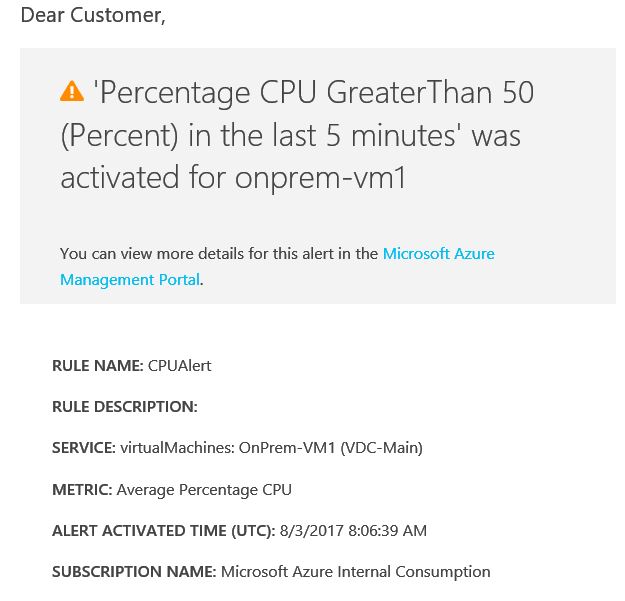
Figure 24: Azure Monitor CPU Alert
13) Stop the Stress program. After another few minutes you should receive another mail informing you that the CPU percentage has reduced.
Finishing up
Sop those are some of the first party services you can use within Azure to monitor network traffic. In the next lab we will create some users and group and control who can do what and against which scope of resources. This is an important aspect of the virtual datacentre, and indeed any enterprise cloud deployment.
Leave a comment